Climate & AI · Practical guide
What Changes When You Give AI Your Local Environmental History?
Most gardening advice starts with the plant name. This approach adds something else: what actually happened in the place where the plant was growing.
Kyoto Horticultural Base · Fushimi, Kyoto · September 26, 2026
Start with the period that matters
“Plant tulips in autumn.” “Lavender likes full sun.” “Repot in spring.” Those answers are not necessarily wrong. But they are general answers.
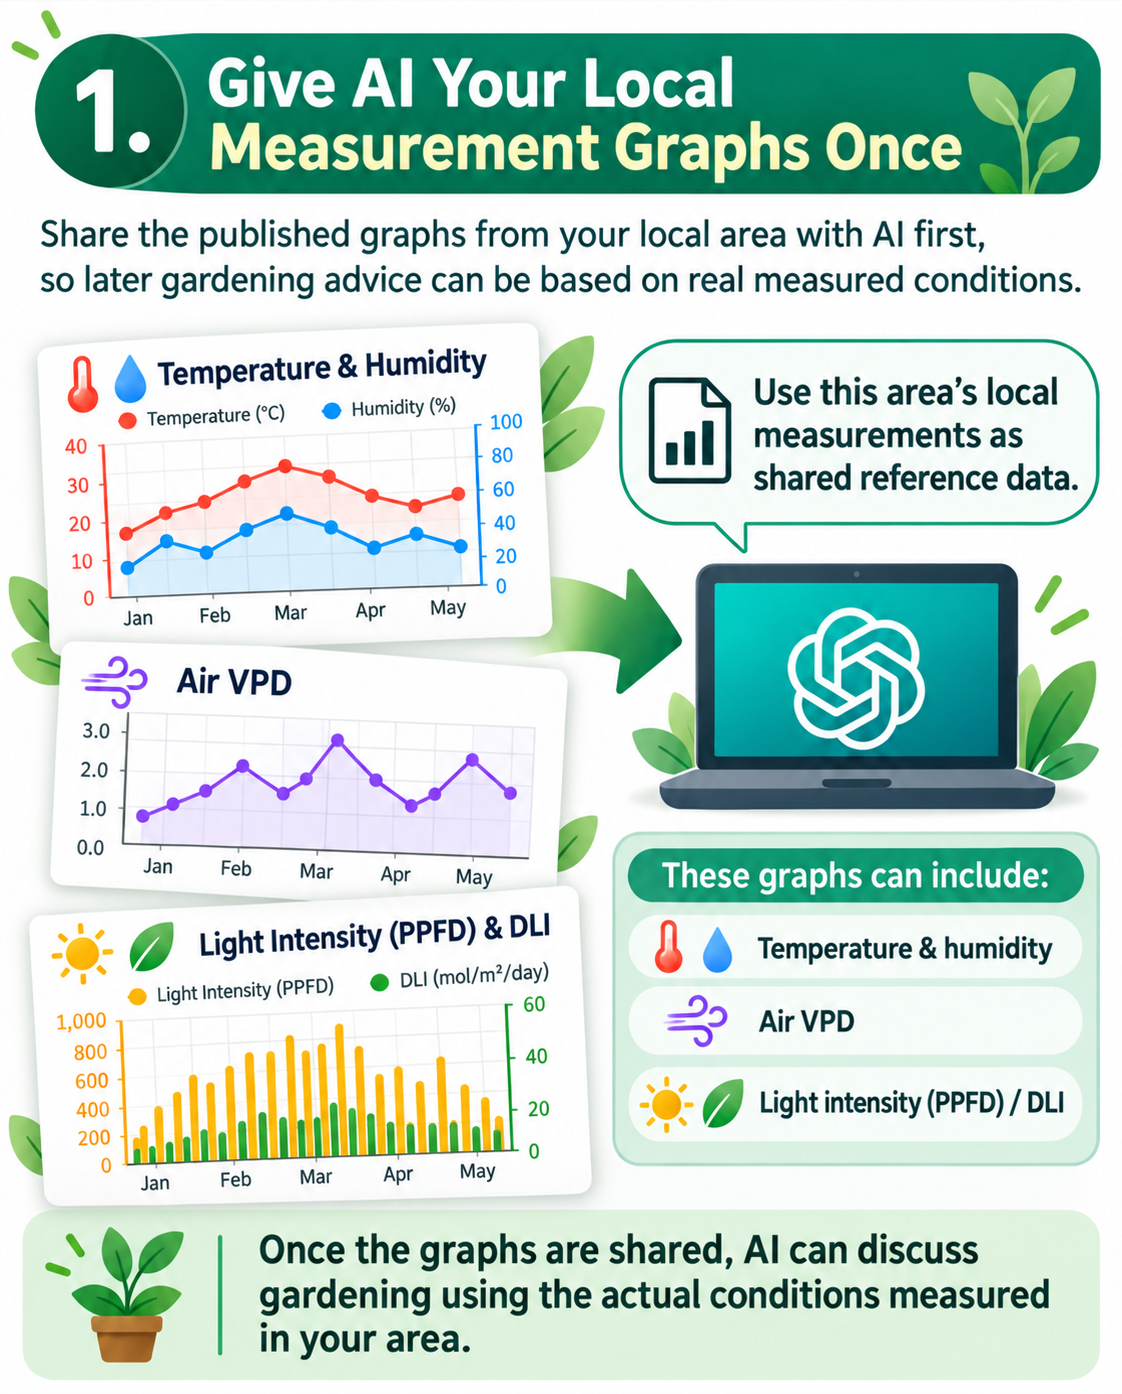
Kyoto Horticultural Base publishes measured temperature, relative humidity, air VPD, PPFD, and daily DLI from one observation point in Fushimi, Kyoto. You can give the relevant graphs to AI and then ask a very ordinary gardening question.
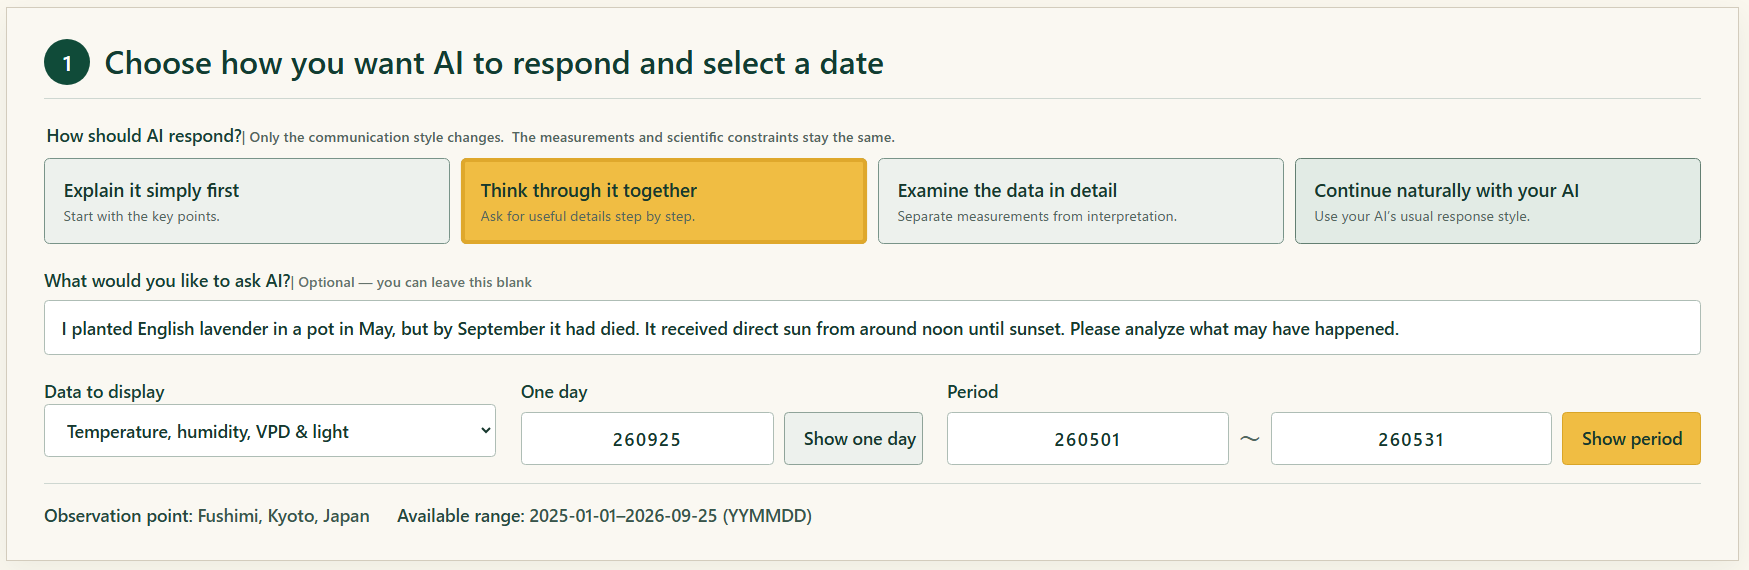
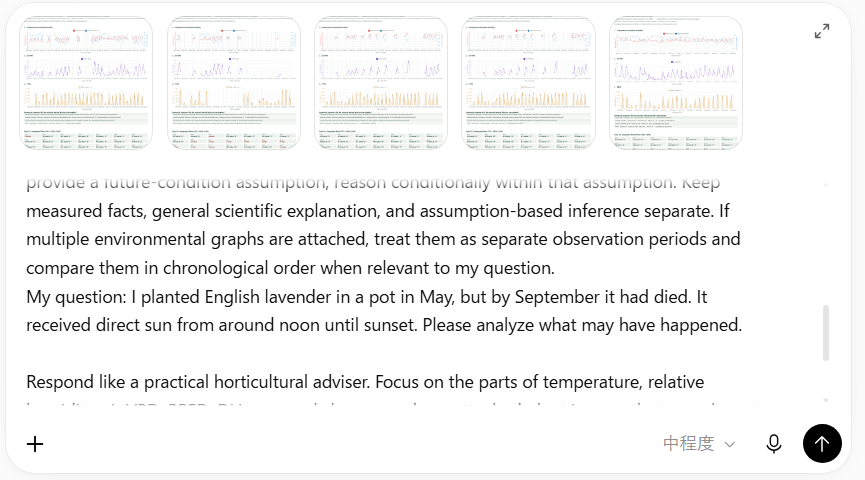
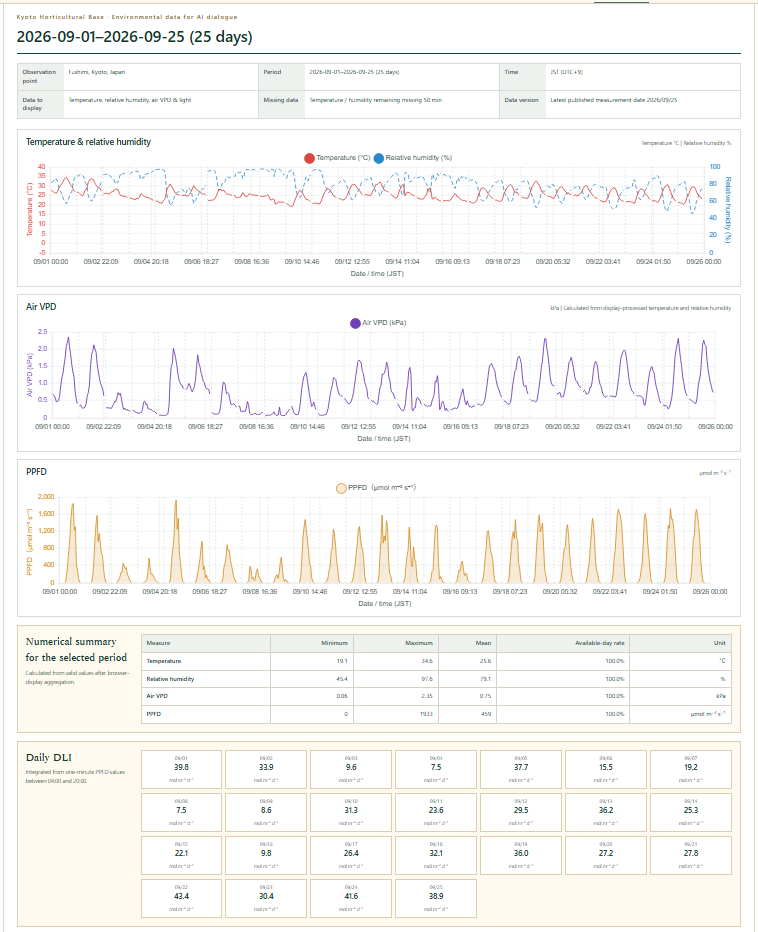
If the environmental graphs for the relevant period are attached, AI can consider how hot the period became, how humid the nights were, how dry the air became during the day, how much light reached the sensor, and whether missing data limits what can be concluded.
The point is not that AI can diagnose a dead plant from a graph alone. The point is that the discussion can begin from environmental conditions that were actually measured nearby, rather than only from a general statement such as “lavender likes sun and good drainage.”
If more information is needed, the next question might be about watering, pot size, substrate, airflow, acclimation, or the order in which symptoms appeared. You can also attach a photo of the plant. A photo does not prove the cause, but it can give AI additional clues about the pattern of decline, leaf damage, wilting, discoloration, or crown condition.
You do not need to upload everything
You can use one month, several months, or only the period connected to the problem you are trying to understand. For a lavender that declined during summer, May to August may be enough for a first discussion. For autumn planting, you might compare September, October, and November.
Start with the part that matters to your question.
Then build the history over time
At first, you may only upload a few months. Later, you may decide to give AI a full year, and eventually more than one year. As the measured history grows, AI has more local context available for comparison.
You can then ask questions such as: “How did autumn cool down last year compared with this year?” “Was summer unusually long?” “Was the plant exposed to a long humid period before decline?” “When should I repot this plant here?”
The graphs do not replace horticultural knowledge. They give that knowledge local environmental context.
A practical way to use a long history
In my current ChatGPT workflow, I can attach 20 graph images at one time. So, with 21 monthly graphs, I send the first 20, then add the remaining graph in the same conversation. If your AI has a different attachment limit, simply divide the graphs into batches that fit.
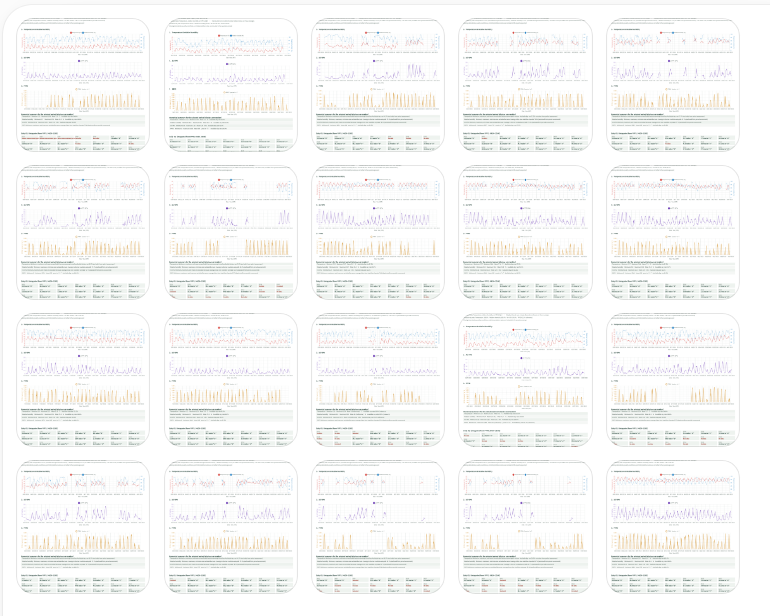
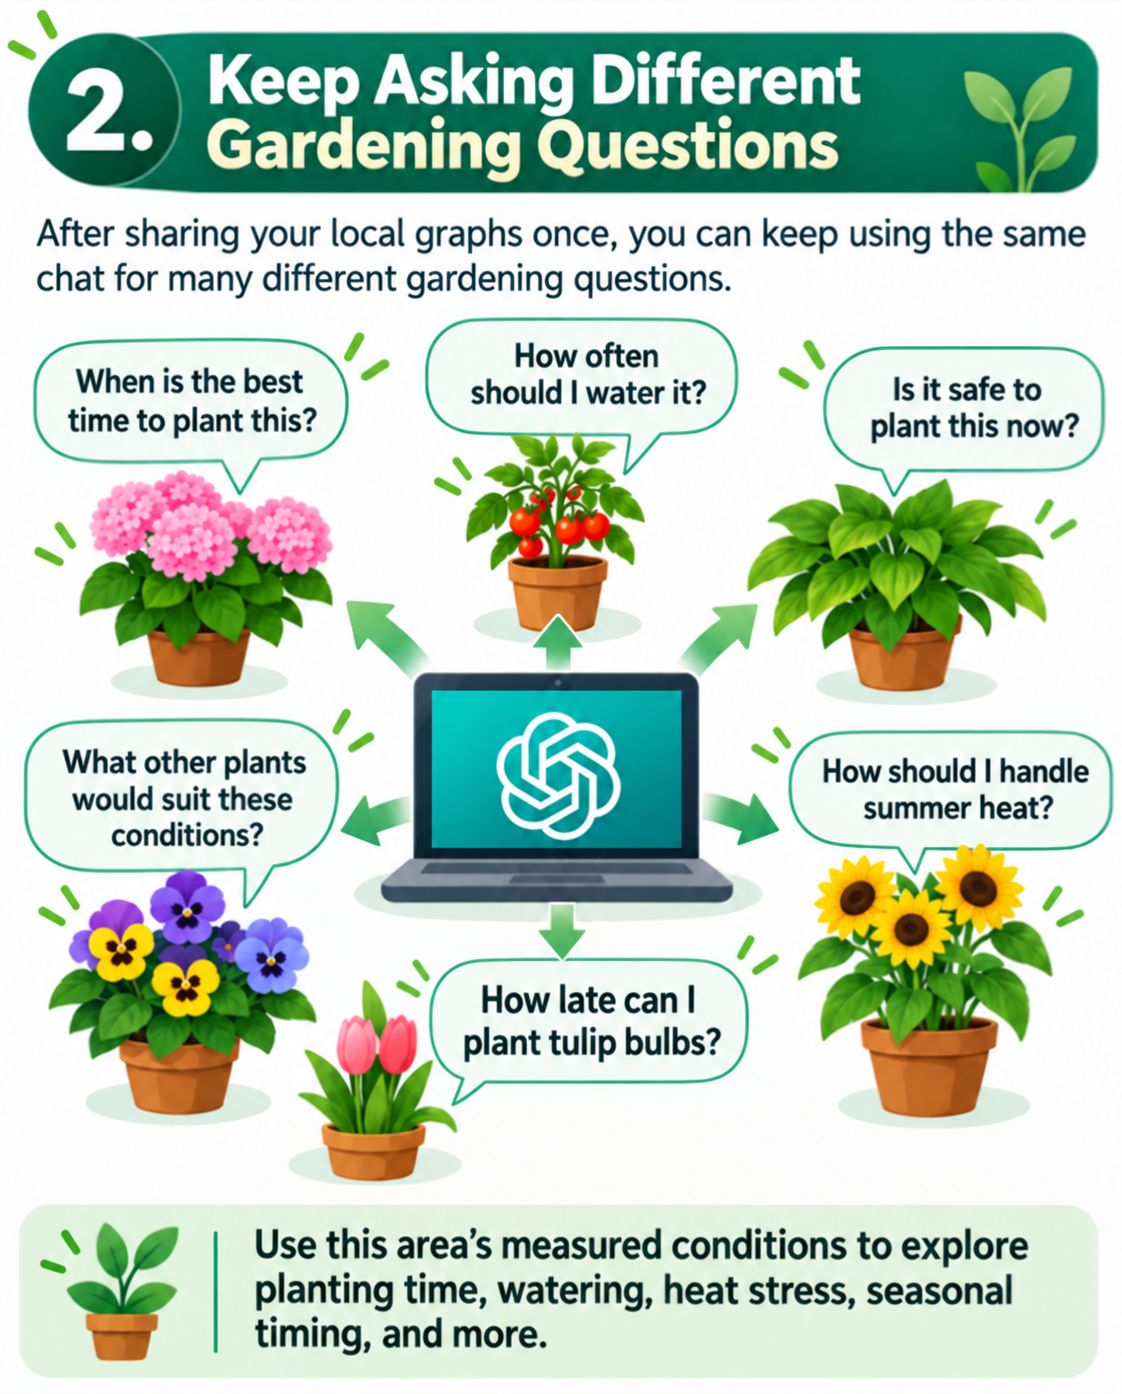
Once all the periods are present in the same chat, you can keep asking new questions without uploading the graphs again each time.
If the AI service you use has a project, library, or similar feature that can keep reference materials available across conversations, you may also consider placing the graphs there as a continuing information source. Features and retention rules differ between AI services, so check the specifications of the service you use.
From a textbook month to a local question
Suppose you find discounted tulip bulbs after the usual planting season. A normal gardening guide may simply tell you that tulips are planted in autumn. But your real question may be more practical.
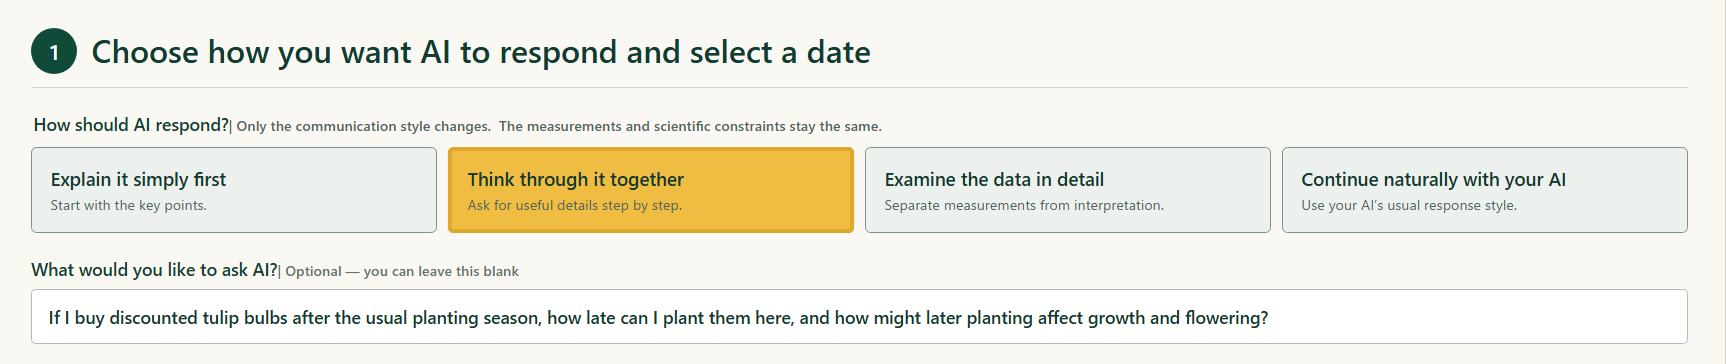
Now the question is not only about a textbook planting month. It is about how quickly the local environment has actually cooled, how winter has progressed, and how much time remains before spring growth. Past measurements cannot predict the future, but they can give AI a richer local reference than a calendar month alone.
Why this matters now
General gardening books and websites have to be broad. They often describe a typical season. But a calendar month does not always mean the same environmental conditions from year to year, especially in a warming climate.
A recommendation such as “plant in October” becomes more useful when you can also ask: “What was October actually like here?” “When did nights begin to cool consistently?” “How did this autumn compare with the previous one?”
We do not yet know whether a year like 2025 should be treated mainly as an extreme outlier or whether similar conditions will occur more often in the future. Each year should therefore be treated as measured history, not as a prediction. As more years are added, comparison becomes more useful.
Source for the 2025 national summer-temperature statement: Japan Meteorological Agency, September 1, 2025.
Light needs even more caution
The PPFD shown on Kyoto Horticultural Base is the light received at one sensor location. It is not a measurement of “Kyoto sunshine” as a whole.
Your own garden may receive much less direct light because of eaves, walls, neighboring buildings, trees, direction, or seasonal changes in the sun’s path. So the useful question is not, “Does my garden have the same PPFD as this sensor?” A better question is, “Which part of this light pattern is relevant to my own location?”
The goal is comparison, not imitation
This approach is not meant to tell someone in another garden, neighborhood, or country that they have the same conditions as this observation point. The measurements provide one local reference. You provide the details of your own place.
That may include elevation, direction, shade, wind exposure, nearby buildings, container size, watering, substrate, purchase timing, and acclimation. The more aware you are of your own location, the more useful the discussion becomes.
Try it with your own question
Choose a response style, select the period you want to examine, copy the prepared prompt, and continue the discussion in your AI conversation.
Open Climate & AI